Outcome of Carotid Endarterectomy after Regional Anesthesia versus General
Anesthesia A Retrospective Study Using Two Independent Databases
Jiabin Liu, MD, PhD, Hector
Martinez-Wilson, MD, PhD, Mark D. Neuman, MD, MSCE, Nabil Elkassabany, MD,
MSCE, Edward Andrew Ochroch, MD, MSCE
Department of Anesthesiology and Critical
Care, the Perelman School of Medicine, University of Pennsylvania,
Philadelphia, PA, USA 19104.
Corresponding Author:
Jiabin Liu, MD, PhD, Department of Anesthesiology and Critical Care, the
Perelman School of Medicine, University of Pennsylvania, 3400 Spruce Street,
Philadelphia, PA, USA 19104. Email: Jiabin.liu@uphs.upenn.edu Phone: 215-573-8239.
Running title: Regional Anesthesia for CEA with Less Complication
Disclosures: The study was supported by
departmental fund to JL at the University of Pennsylvania. MDN receives fund from National Institute on
Aging (K08AG043548-01). The authors
declare no conflict of interest.
NSQIP
disclosure: “The
American College of Surgeons National Surgical Quality Improvement Program and
the hospitals participating in the ACS NSQIP are the source of the data used
herein; they have not verified and are not responsible for the statistical
validity of the data analysis or the conclusions derived by the authors.”
Keywords: Carotid Endarterectomy; Regional Anesthesia; Outcome; NSQIP; NY-SID
Table of Contents
Background: Carotid endarterectomy
(CEA) is effective in reducing stroke risk in selected patient groups. The ideal anesthetic technique remains
controversial in light of literature between general anesthesia (GA) and
regional anesthesia (RA) for CEA.
Methods: We studied the NSQIP data from 2005 to 2012.
There were 32,718 patients receiving general anesthesia (GA) and 5,384 patients
receiving regional anesthesia, local anesthesia, or monitored anesthesia care
(RA). The outcome measurements of 30 days
postoperative complications were death, stroke, coma, unplanned intubation, on
ventilator > 48 hours, cardiac arrest, and myocardial infarction. We next studied NY-SID data from 2007 to
2011. There were 13,913 patients
receiving GA and 3,145 patients receiving RA.
The outcome measurements by discharge time were death, stroke,
paraplegia, new neurological disorder, aspiration, respiratory failure,
pulmonary resuscitation procedure (include intubation), cardiac arrest, cardiac
resuscitation procedure, myocardial infarction, and congestive heart failure.
All analyses were risk adjusted with propensity score matching algorithm.
Results: There
were significant differences in incidences of un-expected intubation (1.21% vs.
0.55%, P=0.001), and myocardial infarction (0.80% vs. 0.35%, P=0.039) between
GA and RA respectively in NSQIP data. GA
group had significant higher incidences of aspiration (0.61% vs. 0.19%,
P=0.014), and pulmonary resuscitation procedure (including intubation) (1.02%
vs. 0.54%, P=0.044) than RA group in NY-SID data.
Conclusions:
In comparison to GA, patients receiving RA had significant lower risks
of postoperative unplanned intubation and/or pulmonary resuscitation procedure
after carotid endarterectomy.
Carotid endarterectomy (CEA) is effective in reducing stroke risk
in selected patient groups. CEA is
commonly performed under general anesthesia (GA), regional anesthesia, local
anesthesia, or monitored anesthesia care.
Based on the typical intraoperative care paradigms, we chose to define
regional anesthesia (RA) to include any of the above local anesthetic based
anesthesia practice, including regional anesthesia, local anesthesia, and
monitored anesthesia care. The choice of
anesthesia is largely based on patient factors, surgeon’s preference, and the
culture of the institution. The ideal
anesthetic technique remains controversial as multiple small studies produced
conflicting results regarding the association of GA versus RA with mortality(1-7), stroke (2-8), hemodynamic homeostasis (1,3-5), and cardiac
morbidity (3,6,7).
The GALA
(general anesthesia versus local anesthesia for carotid surgery) study was the
only large randomized controlled clinical trial with 3526 patients, and it
concluded that there was no difference in incidences of death, stroke, or
myocardial infarction between GA and RA (9).
While GALA study provided the most convincing comparisons between GA and
RA, it has its limitation. The GALA
study reported that 65% of the patients were ASA I or ASA II (9), while other study revealed ~90%
of patients undergoing CEA were ASA III or IV (10).
The American
College of Surgeons National Surgical Quality Improvement Program (NSQIP) is a
nationally validated outcome-based program to measure surgical outcomes. It contains 140 variables, including patient
demographic information, preoperative comorbidities, intraoperative variables,
and 30-day postoperative complications.
A retrospective study by Schechter and colleagues on the NSQIP data from
2005 to 2009 looking at the composite risks of stroke, myocardial infarction,
and death did not show significant patient outcome differences between GA and
RA groups (2.8% versus 3.6%) undergoing CEA (11).
However, Schechter et al. reported significant differences in secondary
complications between GA and RA (4.1% versus 2.9%) without detail information
on the nature of these differences (11).
Leichtle et al. studied the same NSQIP data
from 2005 to 2009 with a propensity matching strategy, and concluded that GA
was associated with higher incidence of myocardial infarction (odds ratio
5.41), while no differences were reported for mortality and stroke risks (10).
With the
release of NSQIP data from 2010-2012 we proposed to take advantage of the much
larger dataset to study low incidence clinically relevant postoperative
complications during CEA. We
hypothesized that there are no differences on 30-day postoperative central
nervous, pulmonary, and cardiovascular system complications
between GA and RA patients.
New York State
Inpatient Database is another independent database publically available via the
US Agency for Healthcare Research and Quality’s (AHRQ) Health Care Utilization
Project (HCUP). The database contains
information on patient demographic information, International Classification of
Diseases-9-Clinical Modification (ICD-9-CM) code for diagnoses, ICD-9-CM code for procedures, anesthesia type, and discharge
status. There was no previous study on
outcome differences between GA and RA among CEA patients in the NY-SID
data. Hereby we propose to utilize the
NY-SID data as a replication set to further test our hypothesis.
Data source:
This study was exempted by the institutional review board (the
University of Pennsylvania, Philadelphia, Pennsylvania, USA 19104).
NSQIP Data: We acquired the American College of
Surgeons National Surgical Quality Improvement Program (NSQIP) database from
2005 to 2012 (http://site.acsnsqip.org).
NSQIP members prospectively submit data on 140 variables, which are
validated via strict standardized protocol.
The data include demographic information, pre-existing comorbidities,
intraoperative variables, and postoperative complications for 30 days after the
surgery. The full list of information
collected is available at NSQIP
(http://site.acsnsqip.org/participant-use-data-file/). The NSQIP participant user data files
included 152,490 subjects in 2005 and 2006, 211,407 subjects in 2007, 271,368
subjects in 2008, 336,190 subjects in 2009, 363,431 subjects in 2010, 442,149
subjects in 2011, and 543,885 subjects in 2012.
NY-SID
Data: We acquired the US Agency for
Healthcare Research and Quality’s (AHRQ) Healthcare Cost and Utilization
Project (HCUP) New York State Inpatient Database (NY-SID) from 2007 to 2011 (http://www.hcup-us.ahrq.gov).
NY-SID includes the collection of all encounter-level information in the
state of New York. The data include
demographic information, anesthesia type, ICD-9-CM diagnosis code, ICD-9-CM
procedure code, AHRQ comorbidity measures of various organs/systems, and
discharge status. The full list of
information collected is available online (http://www.hcup-us.ahrq.gov/db/state/siddist/sid_multivar.jsp, last accessed August 15,
2014). The NY-SID data included
2,608,615 subjects in 2007, 2,629,383 subjects in 2008, 2,661,905 subjects in
2009, 2,612,610 subjects in 2010, and 2,578,680 subjects in 2011.
Study Sample Definition:
NSQIP Study
Sample: To define our study cohort in
NSQIP data, we included patients with the Current Procedural Terminology (CPT)
code for carotid endarterectomy as their principal
procedure (CPT code 35301). There were
total of 54,450 entries with the listed CPT code as principal procedure. We first removed patients with ICD-9-CM diagnosis
other than carotid occlusion and stenosis (ICD-9 433.1, 433.10, or 433.11). We next excluded patients with other
significant concurrent procedures as defined by a relevant concurrent CPT code, which could have
significantly effects on the choice of anesthesia and postoperative
complication rates. (e.g. combined CEA and CABG) We elected to apply work
relative value unit >2.11 as the cutoff criteria to eliminate patients with
significant concurrent procedures, while maintaining patients with relevant
benign procedures that were relevant to carotid endarterectomy
(such as angiography, ultrasonography, arterial cannulation,
etc.). We then removed entries with more than five missing comorbidity data
points. Next, we excluded patients who
received anesthesia type other than general, local, regional, or monitored
anesthesia care. We also excluded
patients with ASA classification 5 (moribund).
Last, we excluded patients who had prior operations within 30 days,
pneumonia, ventilator dependence, systemic inflammatory response syndrome
(SIRS), sepsis, septic shock, or contaminated/infected/dirty wound
classification preoperatively. A diagram
illustrating the defining process is summarized in figure
1.
NY-SID Study
Sample: To define our study cohort in
NY-SID data, we included patients with the primary diagnosis of carotid
occlusion and stenosis with or without cerebral infarction (ICD-9-CM 433.10 or
433.11). There were total of 25,336
entries. We first removed patients
without ICD-9-CM procedure code (3812) in the first three listed procedures. Next,
we excluded patients who received anesthesia type other than general, local, or
regional anesthesia. Last, we excluded
patients who had pneumonia or were ventilator dependent preoperatively. A diagram illustrating the defining process
is summarized in figure 2.
Exposure Variable:
The NSQIP
Participant User Data File coded anesthesia types into the following
categories: general, local, regional, monitored anesthesia care, spinal,
epidural, other, none, or unknown. In
cases where general anesthesia was used concurrently with other type(s) of
anesthesia, patients were coded as receiving general anesthesia. For the present study, we grouped patients
receiving local, regional, or monitored anesthesia care together in a single category
as regional anesthesia.
The NY-SID codes
method of anesthesia types into the following categories: local, general,
regional, other, none, or unknown. In
cases where general anesthesia was used concurrently with other type(s) of
anesthesia, patients were coded as receiving general anesthesia. For the present study, we grouped patients
receiving local and regional anesthesia together in a single category as
regional anesthesia.
Study Variables:
The NSQIP dataset contains demographic information
(age, gender,
height, weight, race), type of anesthesia, American Society of Anesthesiologists (ASA) Physical Status
Classification, level of functional dependence prior to surgery in activities
of daily living, wound classification, and comorbidities. For this study, we created variables
corresponding to the individual system or organ: severe chronic obstructive
pulmonary disease (COPD), congestive heart failure, coronary artery disease
(defined as history of myocardial infarction, prior percutaneous coronary
intervention, previous cardiac surgery, or history of angina in one month
before surgery), peripheral vascular disease (defined as history of
revascularization/amputation for peripheral vascular disease, or rest
pain/gangrene), hypertension requiring medications, diabetes mellitus with or
without insulin treatment, end stage liver disease (defined as presence of
ascites, or esophageal varices), kidney failure (defined as acute renal
failure, or currently on dialysis), central nervous system (CNS) disease
(defined as impaired sensorium, coma>24 hours, history of transient ischemic
attack, cerebrovascular accident/stroke with or without neurological deficit,
or tumor involving CNS), spinal cord injury (defined as hemiplegia, paraplegia,
or quadriplegia), and active malignancy (defined as disseminated cancer,
chemotherapy, or radiotherapy for malignancy).
The NY-SID dataset contains demographic
information (age, gender, race), type of anesthesia, ICD-9-CM diagnosis code, diagnosis present on admission
indicator, ICD-9-CM procedure code, and AHRQ HCUP comorbidity measures. The
comorbidity measures include congestive heart failure, pulmonary circulation
disorders, peripheral vascular disease, chronic pulmonary disease, diabetes,
liver disease, renal failure, central nervous system disease, malignancy, and
etc. The full list is available at http://www.hcup-us.ahrq.gov/db/state/sasddist/sasd_multivar.jsp; last accessed on Aug 15, 2014. The definition of each
comorbidity by ICD-9-CM code is available at http://www.hcup-us.ahrq.gov/toolssoftware/comorbidity/Table2-FY12-V3_7.pdf, last accessed on Aug 15, 2014.
Outcome Variables:
We obtained
data on six postoperative complications within NSQIP database. These included
stroke/CVA, coma > 24 hours, unplanned intubation, on ventilator > 48
hours, cardiac arrest requiring CPR, and myocardial infarction. All six variables were defined as either
diagnosed by surgeon or attending physician, or on the basis of pre-defined
clinical and laboratory criteria as specified at NSQIP website.
We were able to obtain data on 10
postoperative complications within NY-SID database. These included stroke,
paralysis, new neurological disorder, aspiration, respiratory failure,
pulmonary resuscitation procedure (including reintubation
and extended ventilator support), cardiac arrest, cardiac resuscitation
procedure, myocardial infarction, and congestive heart failure. Each variable is identified via ICD-9-CM code
algorithms as previously described (12-15), with additional ICD-9-CM coding
algorithms on paralysis and new neurological disorder at HCUP website (http://www.hcup-us.ahrq.gov/toolssoftware/comorbidity/Table2-FY12-V3_7.pdf, last accessed on Aug 15,
2014).
Statistical Analysis:
A propensity score was calculated with logistic regression modeling that
included all study variables. Variables
for the NSQIP matching algorithm include age, gender, BMI, race, ASA Status, level of functional status, and all pre-existing
comorbidities. Variables for the NY-SID
pairing include age, gender, race, and AHRQ comorbidity measures. The propensity score represented the
probability of receiving RA for each patient in the range of 0 to 1. The propensity scores were then applied to
create two matched groups of GA and RA with the caliper distance of 0.005
without replicates. The matched cohorts
were then compared similarly as described above. All data analyses were executed in STATA 12.1
(StataCorp LP, College Station, TX, USA). Fisher’s
exact test and chi-square test were used for categorical data. Student T-test and Wilcoxon test were applied
for interval data. Statistic
significance was defined as P<0.05.
Our main focus was to compare individual central nervous, pulmonary, and
cardiac system outcomes between GA and RA groups. To compensate the existing differences on
patient characteristics and comorbidities between GA and RA groups, we
conducted propensity score matching algorithm (described below) to generate two
matching groups of GA and RA patients for further analysis.
The cohort from the NSQIP database
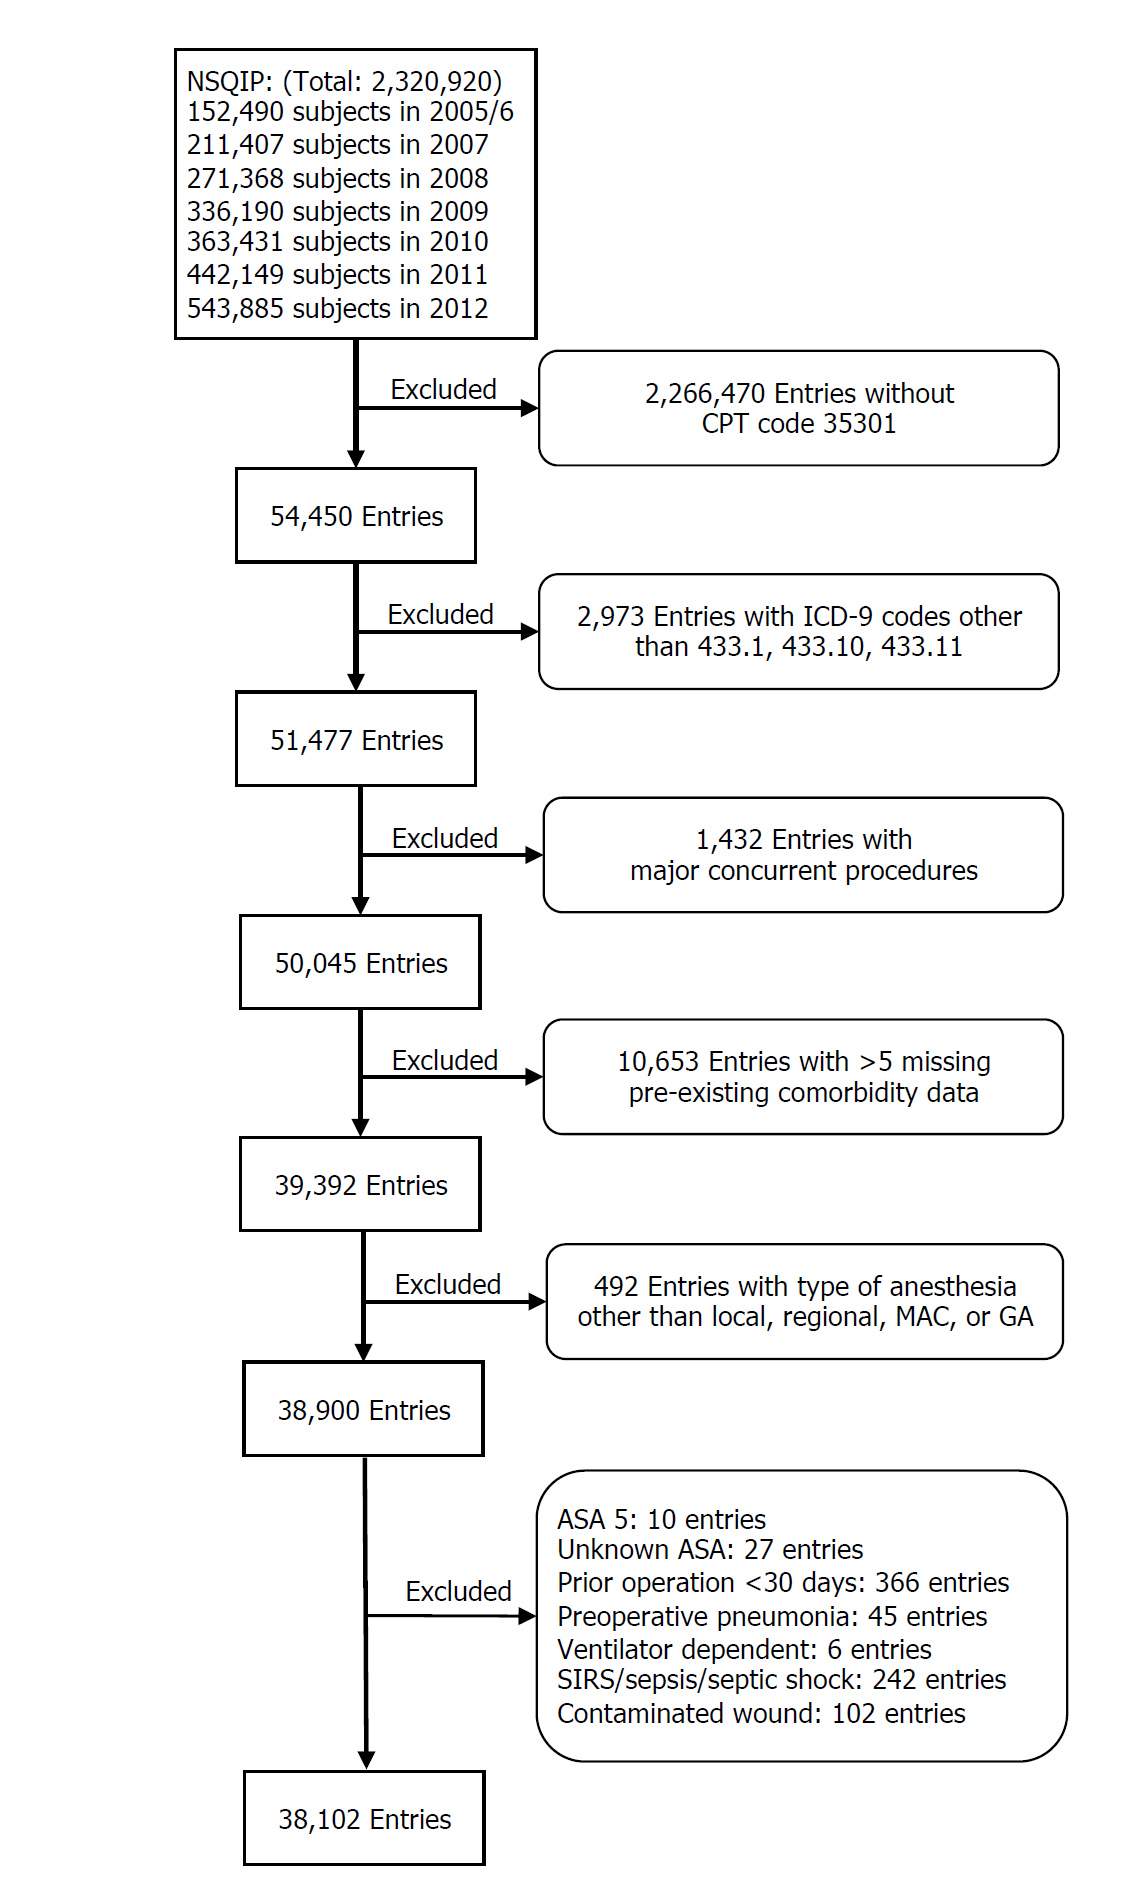
We identified
54,450 patients who underwent carotid endarterectomy
via CPT code between 2005 and 2012 in the NSQIP database (Figure 1). We excluded
2973 patients with concurrent ICD-9 codes other than 433.1, 433.10, or 433.11
(Carotid artery occlusion and stenosis).
We
|
Figure 1. Creation of study sample with NSQIP database. CPT: Current Procedural Terminology. ICD-9: International Classification of Diseases-9. MAC: Monitored Anesthesia Care. GA: General Anesthesia. (review original figure 1 here) |
|
then removed 1432 entries with major
concurrent procedures, and 10,653 entries with more than 5 missing
pre-existing comorbidity data fields.
We next excluded 492 patients with types of anesthesia other than
local, regional, monitored anesthesia care, or general anesthesia. We further eliminated patients with ASA
classification 5 - moribund (n=10), unknown ASA classification (n=27), prior operations within 30 days (n=366),
preoperative pneumonia (n=45), ventilator dependent (n=6), systemic
inflammatory response syndrome (SIRS)/sepsis/septic shock (n=242), and
contaminated/infected/dirty wound classification (n=102).
The final cohort contained 38,102 patients (Figure 1). |
There were
32,718 (85.87%) GA, and 5384 (14.13%) RA subjects in the NSQIP dataset (Table 1).
There were statistical, but probably not clinically, significant
differences in age, gender, BMI, and race.
The average hospitalization days were 2.47 vs. 2.09 days between GA and
RA group (P<0.0001).
Table
1. NSQIP Patient Demographic Information Summary by Anesthesia
Type
|
|
|
General
Anesthesia |
Regional
Anesthesia |
P-value |
||||
|
|
|
N/Mean |
|
%/SD |
N/Mean |
|
%/SD |
|
|
Total Subjects (N) |
32718 |
85.87% |
5384 |
14.13% |
||||
|
Age: |
70.94 |
± |
9.51 |
72.15 |
± |
9.32 |
<0.0001 |
|
|
Gender: |
Male |
19271 |
59.00% |
3243 |
60.45% |
0.046 |
||
|
Female |
13393 |
41.00% |
2122 |
39.55% |
||||
|
Unknown |
54 |
19 |
||||||
|
BMI: |
28.13 |
± |
6.63 |
27.81 |
± |
6.16 |
0.0009 |
|
|
Race: |
White |
27572 |
90.60% |
4502 |
92.24% |
<0.001 |
||
|
Black |
1344 |
4.42% |
147 |
3.01% |
||||
|
Hispanic |
988 |
3.25% |
151 |
3.09% |
||||
|
Others |
529 |
1.74% |
81 |
1.66% |
||||
|
|
Unknown |
2285 |
|
503 |
|
|
||
|
LOS |
2.47 |
± |
5.31 |
2.09 |
± |
6.06 |
<0.0001 |
|
All
values were reported as mean ± SD, or percentage.
The unit
of measure for BMI is kilogram/meter2.
The GA group
had higher prevalence of ASA class III and IV patients (91.14% vs 90.04%), COPD
(10.51% vs 9.51%), diabetes on insulin (9.69% vs 8.64%), and central nervous
system disease (43.33% vs 41.18%) than RA group (Table 2). The RA group had more patients with
hypertension requiring medication (86.53% vs 85.20%), and spinal cord injury
(0.54% vs 0.35%) than GA group. All
subjects were then fitted with the propensity score matching analysis, and a
subgroup of matched patients (n=4880 per group) from the total cohort was
generated for further comparison.
Analysis of preoperative demographic information and pre-existing
comorbidities indicated covariate balance between GA and RA group (Table 3 and Table 4).
Table 5 lists the incidence of central nervous,
pulmonary, and cardiovascular system complications before and after propensity
score matching within 30 days postoperatively in the NSQIP data. The overall 30 day mortality was 0.76% and
0.72% between GA and RA subjects respectively (P=0.906). The RA group had lower incidences of
unplanned intubation after surgery (0.55% vs 1.21%, P=0.001), and myocardial
infarction (0.45% vs 0.80%, P=0.039).
Table 2. NSQIP Prevalence
of Pre-existing Comorbidities.
|
|
|
General
Anesthesia |
Regional
Anesthesia |
|
|||
|
Comorbidity |
|
N |
% |
N |
% |
P-value |
|
|
ASA classification |
4-Life Threat |
4201 |
12.84 |
568 |
10.55 |
<0.001 |
|
|
3-Severe Disturbance |
25618 |
78.30 |
4280 |
79.49 |
|||
|
2-Mild Disturbance |
2850 |
8.71 |
533 |
9.90 |
|||
|
1-No Disturbance |
49 |
0.15 |
3 |
0.06 |
|||
|
Functional health status Prior to Surgery |
Dependent |
97 |
0.30 |
10 |
0.19 |
0.388 |
|
|
Partially Dependent |
1375 |
4.21 |
225 |
4.18 |
|||
|
Independent |
31221 |
95.50 |
5149 |
95.64 |
|||
|
CHF in 30 days before surgery |
258 |
0.79 |
41 |
0.76 |
0.934 |
||
|
Coronary Artery Disease |
11785 |
36.02 |
1964 |
36.48 |
0.520 |
||
|
Peripheral Vascular Disease |
3257 |
10.01 |
509 |
9.45 |
0.210 |
||
|
HTN requiring medication |
27877 |
85.20 |
4659 |
86.53 |
0.010 |
||
|
Dyspnea |
At Rest |
346 |
1.06 |
52 |
0.97 |
0.836 |
|
|
Moderate Exertion |
5596 |
17.10 |
927 |
17.22 |
|||
|
History of severe COPD |
3439 |
10.51 |
512 |
9.51 |
0.026 |
||
|
End Stage Liver Disease |
26 |
0.08 |
5 |
0.09 |
0.795 |
||
|
Renal Failure |
376 |
1.15 |
49 |
0.91 |
0.141 |
||
|
Diabetes Mellitus |
Insulin |
3172 |
9.69 |
465 |
8.64 |
0.047 |
|
|
Oral/Non-insulin |
6062 |
18.53 |
1005 |
18.67 |
|||
|
Central Nervous System Disease |
14178 |
43.33 |
2217 |
41.18 |
0.003 |
||
|
Spinal Cord Injury |
115 |
0.35 |
29 |
0.54 |
0.042 |
||
|
Disseminated cancer,
Chemotherapy/Radiotherapy |
148 |
0.45 |
27 |
0.50 |
0.587 |
||
|
Bleeding disorders |
6723 |
20.55 |
1083 |
20.12 |
0.477 |
||
ASA: American Society of Anesthesiologists; CHF: Congestive heart failure; HTN: Hypertension; COPD: Chronic Obstructive Pulmonary Disease.
Table 3. NSQIP
Patient Demographic Information Summary by Anesthesia Type in the
Propensity Score Matched Sub-groups (N=4880 per
group).
|
|
|
General
Anesthesia |
Regional
Anesthesia |
P-value |
||||
|
|
|
N/Mean |
|
%/SD |
N/Mean |
|
%/SD |
|
|
Age: |
72.10 |
± |
9.21 |
72.16 |
± |
9.36 |
0.7462 |
|
|
Gender: |
Male |
3024 |
61.97% |
2956 |
60.57% |
0.164 |
||
|
Female |
1856 |
38.03% |
1924 |
39.43% |
||||
|
BMI: |
27.86 |
± |
6.12 |
27.84 |
± |
6.16 |
0.8542 |
|
|
Race: |
White |
4502 |
92.25% |
4501 |
92.23% |
0.253 |
||
|
Black |
144 |
2.95% |
147 |
3.01% |
||||
|
Hispanic |
131 |
2.68% |
151 |
3.09% |
||||
|
Others |
103 |
2.11% |
81 |
1.66% |
||||
All
values were reported as mean ± SD, or percentage. The unit of measure for BMI is kilogram/meter2.
“Other race” included patients listed as Native Hawaiian or Pacific Islander,
Asian or Pacific Islander, Asian, and American Indian or Alaska
Native
in the NSQIP database.
Table 4. NSQIP Prevalence of Pre-existing Comorbidities in the Propensity
Score Matched Sub-groups
(N=4880 per group).
|
|
|
General
Anesthesia |
Regional
Anesthesia |
|
|||
|
Comorbidity |
|
N |
% |
N |
% |
P-value |
|
|
ASA classification |
4-Life Threat |
520 |
10.66 |
528 |
10.82 |
0.381 |
|
|
3-Severe Disturbance |
3927 |
80.47 |
3877 |
79.45 |
|||
|
2-Mild Disturbance |
432 |
8.85 |
472 |
9.67 |
|||
|
1-No Disturbance |
1 |
0.02 |
3 |
0.06 |
|||
|
Functional health status Prior to Surgery |
Dependent |
7 |
0.14 |
7 |
0.14 |
0.975 |
|
|
Partially Dependent |
201 |
4.12 |
205 |
4.20 |
|||
|
Independent |
4672 |
95.74 |
4668 |
95.66 |
|||
|
CHF in 30 days before surgery |
34 |
0.70 |
38 |
0.78 |
0.723 |
||
|
Coronary Artery Disease |
1766 |
36.19 |
1793 |
36.74 |
0.585 |
||
|
Peripheral Vascular Disease |
449 |
9.20 |
458 |
9.39 |
0.780 |
||
|
HTN requiring medication |
4241 |
86.91 |
4228 |
86.64 |
0.720 |
||
|
Dyspnea |
At Rest |
52 |
1.09 |
50 |
1.02 |
0.951 |
|
|
Moderate Exertion |
843 |
17.27 |
839 |
17.19 |
|||
|
History of severe COPD |
466 |
9.55 |
467 |
9.57 |
1 |
||
|
End Stage Liver Disease |
9 |
0.18 |
5 |
0.10 |
0.424 |
||
|
Renal Failure |
50 |
1.02 |
41 |
0.84 |
0.400 |
||
|
Diabetes Mellitus |
Insulin |
421 |
8.63 |
430 |
8.81 |
0.873 |
|
|
Oral/Non-insulin |
898 |
18.40 |
912 |
18.69 |
|||
|
Central Nervous System Disease |
1967 |
40.31 |
2015 |
41.29 |
0.333 |
||
|
Spinal Cord Injury |
25 |
0.51 |
24 |
0.49 |
1 |
||
|
Disseminated cancer,
Chemotherapy/Radiotherapy |
30 |
0.61 |
26 |
0.53 |
0.688 |
||
|
Bleeding disorders |
982 |
20.12 |
1000 |
20.49 |
0.669 |
||
ASA: American Society of Anesthesiologists; CHF: Congestive heart failure; HTN: Hypertension;
COPD: Chronic Obstructive Pulmonary Disease.
Table 5. NSQIP Incidences of 30-days Post-operative Complications before
and after Propensity Score Matching
|
|
Before
Propensity Score Matching |
|
After
Propensity Score Matching |
|
|||||||||||
|
|
GA(N=32718) |
RA(N=5384) |
|
GA(N=4880) |
RA(N=4880) |
||||||||||
|
Variable Label |
N |
% |
N |
% |
P-value |
N |
% |
N |
% |
P-value |
|
||||
|
Mortality |
238 |
0.73 |
37 |
0.69 |
0.795 |
37 |
0.76 |
35 |
0.72 |
0.906 |
|
||||
|
Stroke/CVA
|
481 |
1.47 |
77 |
1.43 |
0.854 |
76 |
1.56 |
74 |
1.52 |
0.934 |
|
||||
|
Coma
>24 hours |
20 |
0.06 |
5 |
0.09 |
0.387 |
1 |
0.02 |
5 |
0.10 |
0.219 |
|
||||
|
Unplanned
Intubation |
365 |
1.12 |
27 |
0.50 |
<0.001 |
59 |
1.21 |
27 |
0.55 |
0.001 |
|
||||
|
On Ventilator > 48 Hours |
212 |
0.65 |
24 |
0.45 |
0.091 |
38 |
0.78 |
23 |
0.47 |
0.071 |
|
||||
|
Cardiac Arrest Requiring
CPR |
84 |
0.26 |
10 |
0.19 |
0.377 |
9 |
0.18 |
10 |
0.20 |
1 |
|
||||
|
Myocardial
Infarction |
257 |
0.79 |
25 |
0.46 |
0.010 |
39 |
0.80 |
22 |
0.45 |
0.039 |
|
||||
GA:
General anesthesia; RA:
Regional anesthesia; CVA: Cerebrovascular
accident; CPR: Cardiopulmonary
resuscitation.
Table 6. NY-SID Patient Demographic Information Summary
by Anesthesia Type.
|
|
|
General
Anesthesia |
Regional
Anesthesia |
P-value |
||||
|
|
|
N/Mean |
|
%/SD |
N/Mean |
|
%/SD |
|
|
Total Subjects (N) |
13913 |
81.56% |
3145 |
18.44% |
||||
|
Age: |
71.49 |
± |
9.43 |
71.71 |
± |
9.52 |
0.2433 |
|
|
Gender: |
Male |
8009 |
57.56% |
1889 |
60.06% |
0.010 |
||
|
Female |
5904 |
42.44% |
1256 |
39.94% |
||||
|
Race: |
White |
11942 |
86.52% |
2797 |
89.22% |
<0.001 |
||
|
Black |
467 |
3.38% |
58 |
1.85% |
||||
|
Hispanic |
755 |
5.47% |
107 |
3.41% |
||||
|
Others |
638 |
4.62% |
173 |
5.52% |
||||
|
LOS |
2.60 |
± |
4.91 |
2.05 |
± |
3.14 |
<0.001 |
|
All
values were reported as mean ± SD, or percentage. “Other race”
included patients listed as
Asian or
Pacific Islander, Native American, or other in the NY-SID database. LOS: Length of
Hospital
Stay in days.
Table 7. NY-SID Patient Demographic Information Summary by Anesthesia Type
in the
Propensity Score Matched Sub-groups (N=3134 per
group).
|
|
|
General
Anesthesia |
Local
Anesthesia |
P-value |
||||
|
|
|
N/Mean |
|
%/SD |
N/Mean |
|
%/SD |
|
|
Age: |
71.62 |
± |
9.39 |
71.70 |
± |
9.53 |
0.7224 |
|
|
Gender: |
Male |
1883 |
60.08% |
1883 |
60.08% |
1 |
||
|
Female |
1251 |
39.92% |
151 |
39.92% |
||||
|
Race: |
White |
2779 |
88.67% |
2796 |
89.22% |
0.916 |
||
|
Black |
63 |
2.01% |
58 |
1.85% |
||||
|
Hispanic |
112 |
3.7% |
107 |
3.41% |
||||
|
Others |
180 |
5.4% |
173 |
5.52% |
||||
All
values were reported as mean ± SD, or percentage. “Other race” included patients listed as
Asian or
Pacific Islander, Native American, and other in the NY-SID database.
Table 8. NY-SID Prevalence of Pre-existing Comorbidities in the Propensity
Score Matched
Sub-groups (N=3134 per group).
|
|
General
Anesthesia |
Regional
Anesthesia |
|
|||
|
Comorbidity |
N |
% |
N |
% |
P-value |
|
|
Alcohol |
49 |
1.56 |
48 |
1.53 |
1 |
|
|
Deficiency Anemia |
117 |
3.73 |
135 |
4.31 |
0.274 |
|
|
Rheumatoid Arthritis / Collagen Vascular
Disease |
48 |
1.53 |
46 |
1.47 |
0.917 |
|
|
Chronic Blood Loss Anemia |
9 |
0.29 |
10 |
0.32 |
1 |
|
|
Congestive Heart Failure |
140 |
4.47 |
162 |
5.17 |
0.215 |
|
|
Chronic Pulmonary Disease |
642 |
20.49 |
657 |
20.96 |
0.663 |
|
|
Coagulopathy |
21 |
0.67 |
25 |
0.80 |
0.658 |
|
|
Drug Abuse |
3 |
0.10 |
6 |
0.19 |
0.507 |
|
|
Hypertension |
2563 |
81.78 |
2564 |
81.81 |
1 |
|
|
Liver Disease |
25 |
0.80 |
29 |
0.93 |
0.682 |
|
|
Fluid / Electrolyte Disorders |
73 |
2.33 |
87 |
2.78 |
0.298 |
|
|
Obesity |
185 |
5.90 |
196 |
6.25 |
0.597 |
|
|
Paralysis |
0 |
0 |
4 |
0.13 |
0.125 |
|
|
Peripheral Vascular Disorders |
560 |
17.87 |
574 |
18.32 |
0.670 |
|
|
Pulmonary Circulation Disorders |
32 |
1.02 |
34 |
1.08 |
0.902 |
|
|
Renal Failure |
219 |
6.99 |
238 |
7.59 |
0.382 |
|
|
Valvular Disease |
231 |
7.37 |
246 |
7.85 |
0.505 |
|
|
Weight Loss |
4 |
0.13 |
8 |
0.26 |
0.387 |
|
|
Mental Disorder |
199 |
6.35 |
213 |
6.80 |
0.508 |
|
|
Cancer |
43 |
1.37 |
49 |
1.56 |
0.600 |
|
|
Diabetes |
922 |
29.42 |
938 |
29.93 |
0.678 |
|
Mental disorder: includes depression and
psychoses; Cancer: includes lymphoma, metastatic
Cancer, and solid
tumor without metastasis; Diabetes includes insulin dependent and
insulin
independent diabetes;
Table 9. NY-SID Prevalence of Pre-existing Comorbidities.
|
|
|
General
Anesthesia |
Regional
Anesthesia |
|
|||
|
Comorbidity |
|
N |
% |
N |
% |
P-value |
|
|
Alcohol |
163 |
1.17 |
48 |
1.53 |
0.108 |
||
|
Deficiency Anemia |
810 |
5.82 |
135 |
4.29 |
0.001 |
||
|
Rheumatoid Arthritis/ Collagen Vascular
Disease |
313 |
2.25 |
48 |
1.53 |
0.011 |
||
|
Chronic Blood Loss Anemia |
34 |
0.24 |
11 |
0.35 |
0.333 |
||
|
Congestive Heart Failure |
749 |
5.38 |
163 |
518 |
0.693 |
||
|
Chronic Pulmonary Disease |
2987 |
21.47 |
660 |
20.99 |
0.563 |
||
|
Coagulopathy |
139 |
1.00 |
25 |
0.79 |
0.313 |
||
|
Drug Abuse |
49 |
0.35 |
6 |
0.19 |
0.167 |
||
|
Hypertension |
11444 |
82.25 |
2573 |
81.81 |
0.553 |
||
|
Liver Disease |
89 |
0.64 |
29 |
0.92 |
0.095 |
||
|
Fluid / Electrolyte Disorders |
711 |
5.11 |
87 |
2.77 |
<0.001 |
||
|
Obesity |
771 |
5.54 |
196 |
6.23 |
0.135 |
||
|
Paralysis |
27 |
0.19 |
4 |
0.13 |
0.642 |
||
|
Peripheral Vascular Disorders |
2405 |
17.29 |
575 |
18.28 |
0.185 |
||
|
Pulmonary Circulation Disorders |
137 |
0.98 |
34 |
1.08 |
0.620 |
||
|
Renal Failure |
1022 |
7.35 |
239 |
7.60 |
0.624 |
||
|
Valvular
Disease |
1023 |
7.35 |
247 |
7.85 |
0.328 |
||
|
Weight Loss |
32 |
0.23 |
8 |
0.25 |
0.838 |
||
|
Mental Disorder |
987 |
7.09 |
215 |
6.84 |
0.643 |
||
|
Cancer |
209 |
1.50 |
49 |
1.56 |
0.808 |
||
|
Diabetes |
4475 |
32.16 |
939 |
29.86 |
0.012 |
||
Mental disorder: includes depression and
psychoses; Cancer: includes lymphoma, metastatic Cancer,
and solid tumor without metastasis; Diabetes includes
insulin dependent and independent diabetes.
The cohort from the NY-SID data
We then set
out to replicate these findings in the NSQIP data in the NY-SID data where we
identified 25,336 patients with CEA listed within the first three procedures (Figure 2). We
then removed 1863 patients without carotid occlusion and stenosis with or
without cerebral infarction enlisted as primary diagnosis. Next, we excluded 6295 patients who received
anesthesia type other than general, local, or regional anesthesia. Last, we excluded patients with preoperative pneumonia (n=4) and respiratory
failure (n=116). The final cohort
contained 17,058 subjects (Figure 2).
There were 13,913
subjects in the GA group and 3,145 subjects in the RA group in the NY-SID
patient’s database (Table 6). The average length of
hospitalization was 2.60 vs 2.05 days between GA and RA group (P<0.001). Further
analysis of the comorbidities indicated several differences (Table 7). The GA group had higher prevalence of patients with anemia (5.82% vs
4.29%), rheumatoid arthritis / collagen vascular disease (2.25% vs 1.53%),
fluid / electrolyte
|
Figure 2. Creation of study sample with NY-SID
database. ICD-9: International
Classification of Diseases-9.
ICD-9-CM: International Classification of Diseases-9 Clinical
Modification. GA: General Anesthesia. (review original figure 2 here) |
disorder (5.11% vs 2.77%), and diabetes
(32.16% vs 29.86%) than RA group. All
subjects were then fitted with the propensity score matching analysis with
NY-SID variables, and a subgroup of matched patients (n=3134 per group) from
the total cohort was generated for further comparison. Analysis of preoperative demographic
information and pre-existing comorbidities indicated the equality between GA
and RA group (Table 8 and Table 9).
Table 10. NY-SID Incidences of Post-admission Complications before and after
Propensity Score Matching
|
|
Before
Propensity Score Matching |
|
After
Propensity Score Matching |
|
|||||||||||||
|
|
GA(N=13913) |
RA(N=3145) |
|
GA(N=3134) |
RA(N=3134) |
||||||||||||
|
Variable Label |
N |
% |
N |
% |
P-value |
N |
% |
N |
% |
P-value |
|
||||||
|
Mortality |
43 |
0.31 |
3 |
0.10 |
0.035 |
8 |
0.26 |
3 |
0.10 |
0.226 |
|
||||||
|
Stroke
|
33 |
0.24 |
5 |
0.16 |
0.531 |
4 |
0.13 |
5 |
0.16 |
1 |
|
||||||
|
Paralysis |
62 |
0.45 |
7 |
0.22 |
0.086 |
12 |
0.38 |
7 |
0.22 |
0.359 |
|
||||||
|
Other
Neurologic Disorder |
66 |
0.47 |
10 |
0.32 |
0.299 |
13 |
0.41 |
10 |
0.32 |
0.677 |
|
||||||
|
Aspiration |
73 |
0.52 |
6 |
0.19 |
0.012 |
19 |
0.61 |
6 |
0.19 |
0.014 |
|
||||||
|
Respiratory
Failure |
302 |
2.17 |
40 |
1.27 |
0.001 |
49 |
1.56 |
40 |
1.28 |
0.393 |
|
||||||
|
Pulmonary
Resuscitation Procedure |
178 |
1.28 |
17 |
0.54 |
<0.001 |
32 |
1.02 |
17 |
0.54 |
0.044 |
|
||||||
|
Cardiac Arrest |
284 |
2.04 |
57 |
1.81 |
0.438 |
54 |
1.72 |
57 |
1.82 |
0.848 |
|
||||||
|
Cardiac
Resuscitation Procedure |
31 |
0.22 |
4 |
0.13 |
0.384 |
2 |
0.06 |
4 |
0.13 |
0.687 |
|
||||||
|
Myocardial
Infarction |
134 |
0.96 |
19 |
0.60 |
0.059 |
26 |
0.83 |
19 |
0.61 |
0.370 |
|
||||||
|
Congestive
Heart Failure |
76 |
0.55 |
14 |
0.45 |
0.586 |
10 |
0.32 |
13 |
0.41 |
0.667 |
|
||||||
GA:
General anesthesia; RA:
Regional anesthesia;
The overall
inpatient mortalities were 0.26% and 0.10% in the GA and RA groups (P=0.226),
which were lower than the 30 days mortality rate in NSQIP data as expected
(Table 10). RA group was associated with
lower incidences of aspiration (0.19% vs 0.61%, P=0.014), pulmonary
resuscitation procedure including reintubation and
ventilator support after surgery (0.54% vs 1.02%, P=0.044). There was no difference of myocardial
infarction (0.61% vs 0.83%, P=0.370) in the NY-SID data.
Our study using prospectively collected NSQIP
data of 38,102 CEA patients and NY-SID data of 17,058 CEA patients suggests
that regional anesthesia was associated with better outcome indicated by some
of the complication indexes.
Why the
current study is needed?
There were many studies comparing general
anesthesia and regional anesthesia in CEA.
However, most studies were limited by sample size to be conclusive. Meta-analysis could potentially draw
conclusions to this debate. However, the
heterogeneity of these studies could not adequately power the meta-analysis to
draw convincing conclusion. A
meta-analysis with 48 studies in 2007, including 14 prospective and 34
retrospective studies (16) concluded
that, lower incidences of death, stroke, and myocardial infarction in patients
receiving RA despite of the limited study power due to the low number of
prospective studies (16). However, the multicenter randomized
prospective control trial, GALA trial with total of 3526 patients, found no
differences in mortality, stroke, myocardial infarction, or length of hospital
stay (9). A
recent meta-analysis of 14 trials and 4596 operations noticed there were lower
incidences of stroke and mortality in RA group compared to GA group, while the
differences were not statistically significant (17). We took advantage of the two
available large databases to address this debate on anesthesia type and
surgical outcome in CEA.
Our results support these previous reports that
there were no differences in mortality and stroke risks between GA and RA
groups. NSQIP data showed significant
lower incidence of myocardial infarction.
However, NY-SID data did not support the hypothesis of lower incidence
of myocardial infarction. This is likely
due to the fact that NY-SID database only included ICD-9-CM code information to
the point of hospital discharge, and thus potentially missed later onset complications,
such as myocardial infarction, which were routinely monitored in the NSQIP data
collection process. Nonetheless, our
analysis on two large databases with 38,102 and 17,058 CEA operations provided
valuable information on incidence of myocardial infarction at a much larger
scale.
Pulmonary
complications have not been well studied.
Our analysis indicated differences in risks of unplanned intubation
after surgery between GA and RA in the NSQIP data. Our analysis also verified the lower
incidence of unplanned intubation/ prolonged ventilator support in the RA group
in the NY-SID data. Furthermore, NY-SID
data indicated RA group is associated with lower incidence of aspiration
risk. Unfortunately, the incidence of
aspiration could not be studied in the NSQIP data due to lack of such information. To our best knowledge, this is the first
study with special focus on pulmonary complications. While the overall mortality and stroke risks
were similar between GA and RA patients, these secondary postoperative
complications could have significant implications on the requirement of
perioperative resources, the length of hospitalization, and the quality of life
of patients. The difference might cast
significant socioeconomic influence on the patient and health care system.
Limitations of the study
The authors
acknowledge that the conclusion of this study is limited due to the
retrospective nature of this study design.
The coding system of anesthesia type in the NSQIP and NY-SID databases
is also a significant limitation. In
case of concurrent use of general anesthesia with any other type(s) of
anesthesia, patients were coded as receiving general anesthesia. Therefore, patients who were initially
planned for RA and converted to GA might represent intraoperative complications
that would show up as postoperative complications and thus be miss-assigned
with anesthesia type. The NSQIP database
also removed hospital and surgeon identification information in order to comply
with participation agreement between NSQIP and participating sites. However, this information might be of
interest to adjust relative risks.
Similarly, there are limitations in the NY-SID database. NY-SID contains encounter-level information,
and the integrity of the data relies on the accuracy of ICD-9-CM coding. Although many studies have validated the
reliability of ICD-9-CM coding algorithm in outcome studies, the retrospective
nature limited the study power.
Our study showed that regional anesthesia was associated with lower incidences of unexpected
intubation and pulmonary resuscitation procedure after CEA compared to general anesthesia.
The study of two large independent databases, NSQIP database and NY-SID
database, provided more evidence on the potential beneficial effect of regional
anesthesia on pulmonary complications among CEA patients. However, the choice of type of anesthesia for
CEA should also be based on surgeon’s recommendation and patient’s preference
considering the limited benefit with regional anesthesia.
Acknowledgement: The authors
would like to thank Dr. Stanley Muravchick for reading the manuscript and
valuable feedback.
1. Bowyer MW, Zierold D, Loftus JP, Egan JC, Inglis KJ, Halow
KD. Carotid endarterectomy: a comparison of regional versus general anesthesia
in 500 operations. Annals of vascular surgery 2000;14:145-51.
2. Mofidi R, Nimmo AF, Moores C, Murie JA, Chalmers RT. Regional
versus general anaesthesia for carotid endarterectomy: impact of change in
practice. The surgeon : journal of the Royal Colleges of Surgeons of Edinburgh
and Ireland 2006;4:158-62.
3. Sternbach Y, Illig KA, Zhang R, Shortell CK, Rhodes JM,
Davies MG, Lyden SP, Green RM. Hemodynamic benefits of regional anesthesia for
carotid endarterectomy. Journal of vascular surgery 2002;35:333-9.
4. Watts K, Lin PH, Bush RL, Awad S, McCoy SA, Felkai D, Zhou W,
Nguyen L, Guerrero MA, Shenaq SA, Lumsden AB. The impact of anesthetic modality
on the outcome of carotid endarterectomy. American journal of surgery
2004;188:741-7.
6. Ferrero E, Ferri M, Viazzo A, Ferrero M, Gaggiano A, Berardi
G, Pecchio A, Piazza S, Cumbo P, Nessi F. Carotid endarterectomy: comparison
between general and local anesthesia. Revision of our experience with 428
consecutive cases. Annals of vascular surgery 2010;24:1034-7.
7. Kasprzak PM, Altmeppen J, Angerer M, Mann S, Mackh J, Topel
I. General versus locoregional anesthesia in carotid surgery: a prospective
randomised trial. VASA Zeitschrift fur Gefasskrankheiten 2006;35:232-8.
8. Gurer O, Yapici F, Enc Y, Cinar B, Ketenci B, Ozler A. Local
versus general anesthesia for carotid endarterectomy: report of 329 cases.
Vascular and endovascular surgery 2003;37:171-7.
10. Leichtle SW, Mouawad NJ, Welch K, Lampman R, Whitehouse WM,
Jr., Heidenreich M. Outcomes of carotid endarterectomy under general and
regional anesthesia from the American College of Surgeons' National Surgical
Quality Improvement Program. Journal of vascular surgery 2012;56:81-8 e3.
11. Schechter MA, Shortell CK, Scarborough JE. Regional versus
general anesthesia for carotid endarterectomy: the American College of Surgeons
National Surgical Quality Improvement Program perspective. Surgery
2012;152:309-14.
13. Silber JH, Romano PS, Rosen AK, Wang Y, Even-Shoshan O, Volpp
KG. Failure-to-rescue: comparing definitions to measure quality of care.
Medical care 2007;45:918-25.
14. Matsen SL, Chang DC, Perler BA, Roseborough GS, Williams GM.
Trends in the in-hospital stroke rate following carotid endarterectomy in
California and Maryland. Journal of vascular surgery 2006;44:488-95.
15. Neuman MD, Silber JH, Elkassabany NM, Ludwig JM, Fleisher LA.
Comparative effectiveness of regional versus general anesthesia for hip
fracture surgery in adults. Anesthesiology 2012;117:72-92.
16. Guay J. Regional or general anesthesia for carotid
endarterectomy? Evidence from published prospective and retrospective studies.
Journal of cardiothoracic and vascular anesthesia 2007;21:127-32.
17. Vaniyapong T, Chongruksut W, Rerkasem K. Local versus general
anaesthesia for carotid endarterectomy. Cochrane Database Syst Rev
2013;12:CD000126.